Concept2 Erg Time Rankings
Motivation
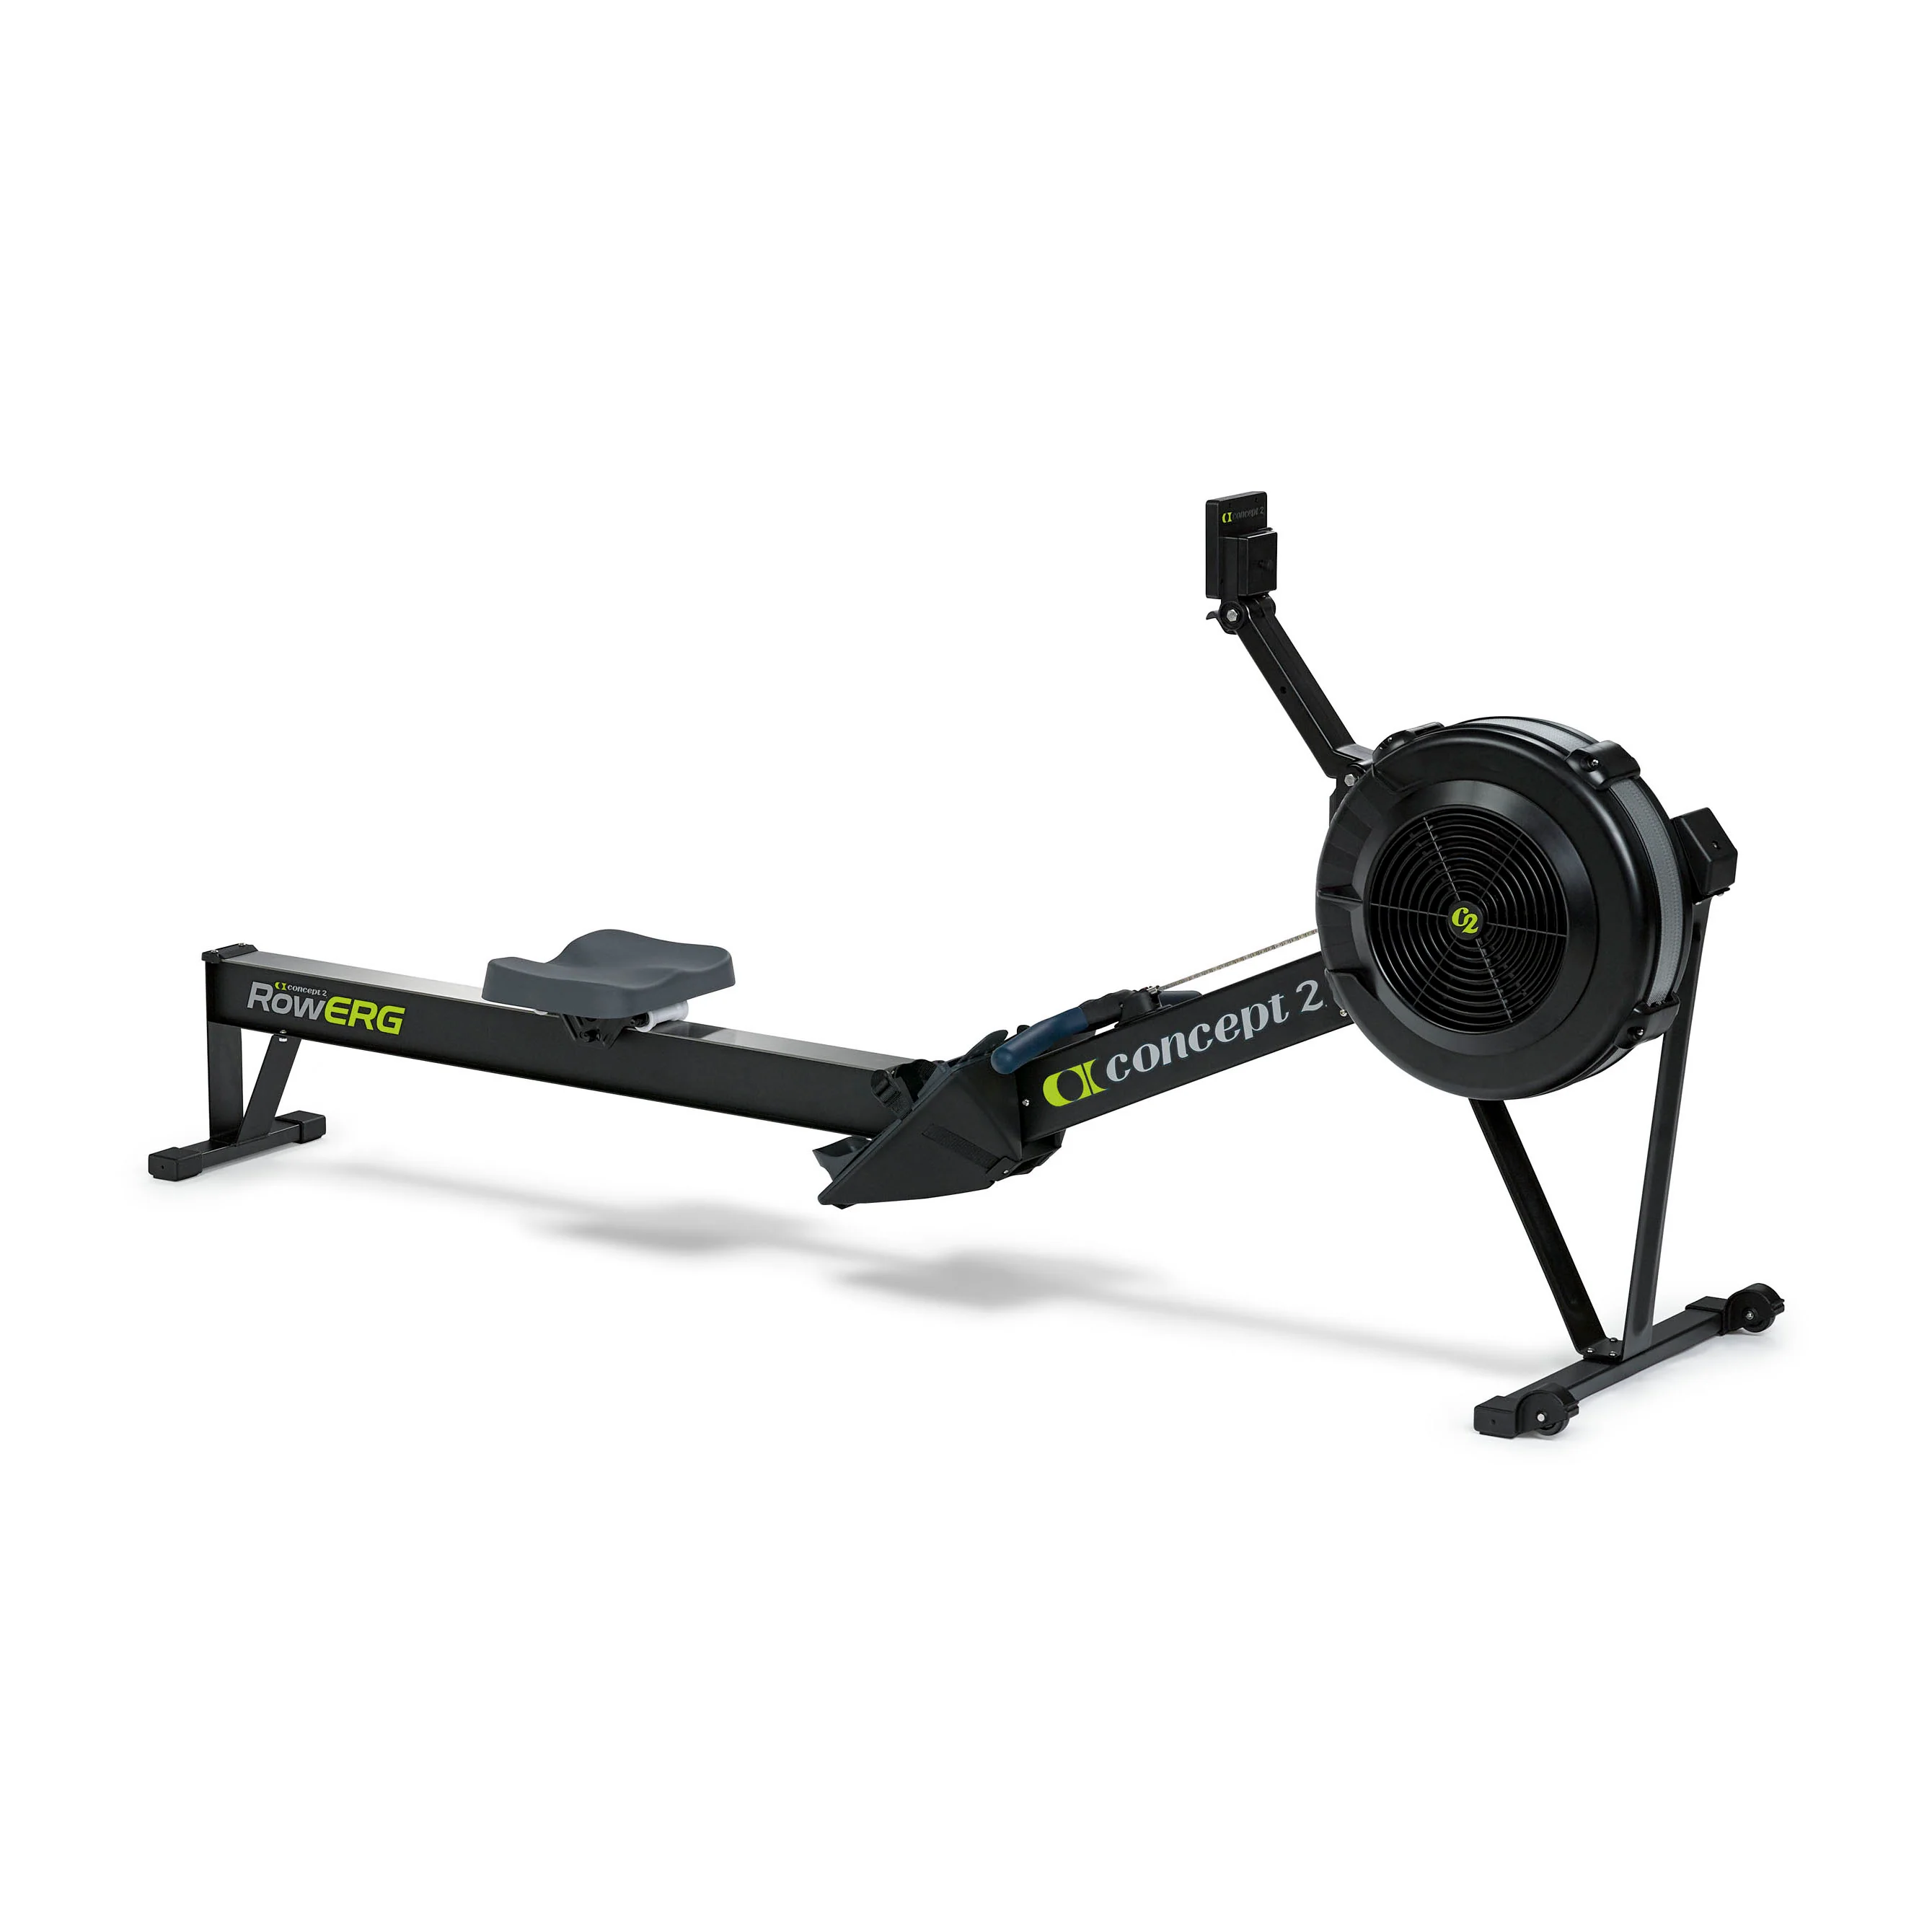
Indoor Rowing (Erging) is a form of indoor exercise. Erging is primarily used by rowers to prepare for the season while the water is frozen over. It can also be a form of cardio exercise for non-rowers. Erging involves sitting down on a rowing machine while pulling a handle towards the stomach. There are several variations of the rowing machine but the most common one is pictured below.
The below video shows the motion of erging.
Concept2 is the main company that sells ergs and other rowing equipment. All Concept2 ergs are equipped with performance monitor screens which measure a rowers, speed, time, rate, and distance. Since 1999, rowers have been able to log their ergs on an online logbook which until then had been physical. In 2022, Concept2 released the ErgData App which connects to performance monitors via Bluetooth, when rowers use this app the data is immediately uploaded to their logbooks but it is still possible to manually record workouts in the online logbook. In the online logbook, Concept2 includes the option for rowers to “Rank” certain common workouts to compare with other rowers globally. These rankings are available to the general public on the Concept2 website.
The erg.csv dataset contains data from the 2018-2023 rankings. The dataset includes the top 50 erg times for 2k, 6k, and 10k distances for both men and women. In looking at the speeds and times for the different distances it will be interesting to identify any potential patterns amongst the groups.
Data
The data set has 1,800 rows with 14 variables. Each row is an erg piece completed by a rower between 2018 and 2023. There are 1,088 different rowers in the dataset, with 50 erg pieces in each category.
| Variable | Description |
|---|---|
Pos |
The position or ranking of the piece. |
Name |
The name of the rower that completed the piece. |
Age |
The age of the rower that completed the piece. |
Location |
Where the rower that completed the piece is from. |
Country |
The country that the rower that completed the piece is from. |
Affiliation |
The club or team affiliation of the rower that completed the piece. |
Type |
The type of erg the piece was completed on, S for slides meaning the erg is on slides, D for dynamic which is an erg in which the footboards move, and R for a traditional RowErg. |
Verified |
If the piece was verified, meaning it was recorded on the app or in a race as opposed to being manually entered, Yes or No. |
Time |
The total time for the piece in minutes. |
Gender |
The gender of the rower that completed the piece, Women or Men. |
Year |
The year the piece was completed. |
Distance |
The distance of the piece in meters, 2000, 6000, or 10000. |
Speed |
The average speed of the piece in meters per minute. (Distance/Time) |
Split |
The average 500 meter split of the piece, meaning the average time per 500 meters of the piece. (500*(Time/Distance)) |
Age_Group |
The age group the rower that completed the piece is in. The age groups are defined by Concept2 on the rankings page. There are 9 age groups in the dataset. |
Questions
Make a side-by-side boxplot of the
SpeedforVerifiedandNon-Verifiedpieces. Give the plot a label.Describe any interesting features of the plot.
Find the summary statistics for
Speedand calculate its IQR.Make a table of the top 10 speeds for rowers. Including only their
Name,Speedand if their piece wasVerified.Using the table, identify the 4 outliers seen in the boxplot.
Perform a test to evaluate if there is a significant difference in the mean
SpeedforVerifiedandNon-Verifiedpieces.Make a new dataset which does not have the 4 outliers in it.
With the new dataset make another side-by-side boxplot of the
SpeedforVerifiedandNon-Verifiedpieces and give the plot a label.Comment on the features of this new boxplot.
Perform a test with the new dataset and re-evalute if there is a significant difference in the mean
SpeedforVerifiedandNon-Verifiedpieces.What does the number of outliers for
Non-Verifiedpieces say about the reliability ofNon-Verifiedpieces in the dataset?Is it ethical to remove the outliers from the dataset as done in task 7?
References
Data obtained from log.concept2.com website